10k (PC)


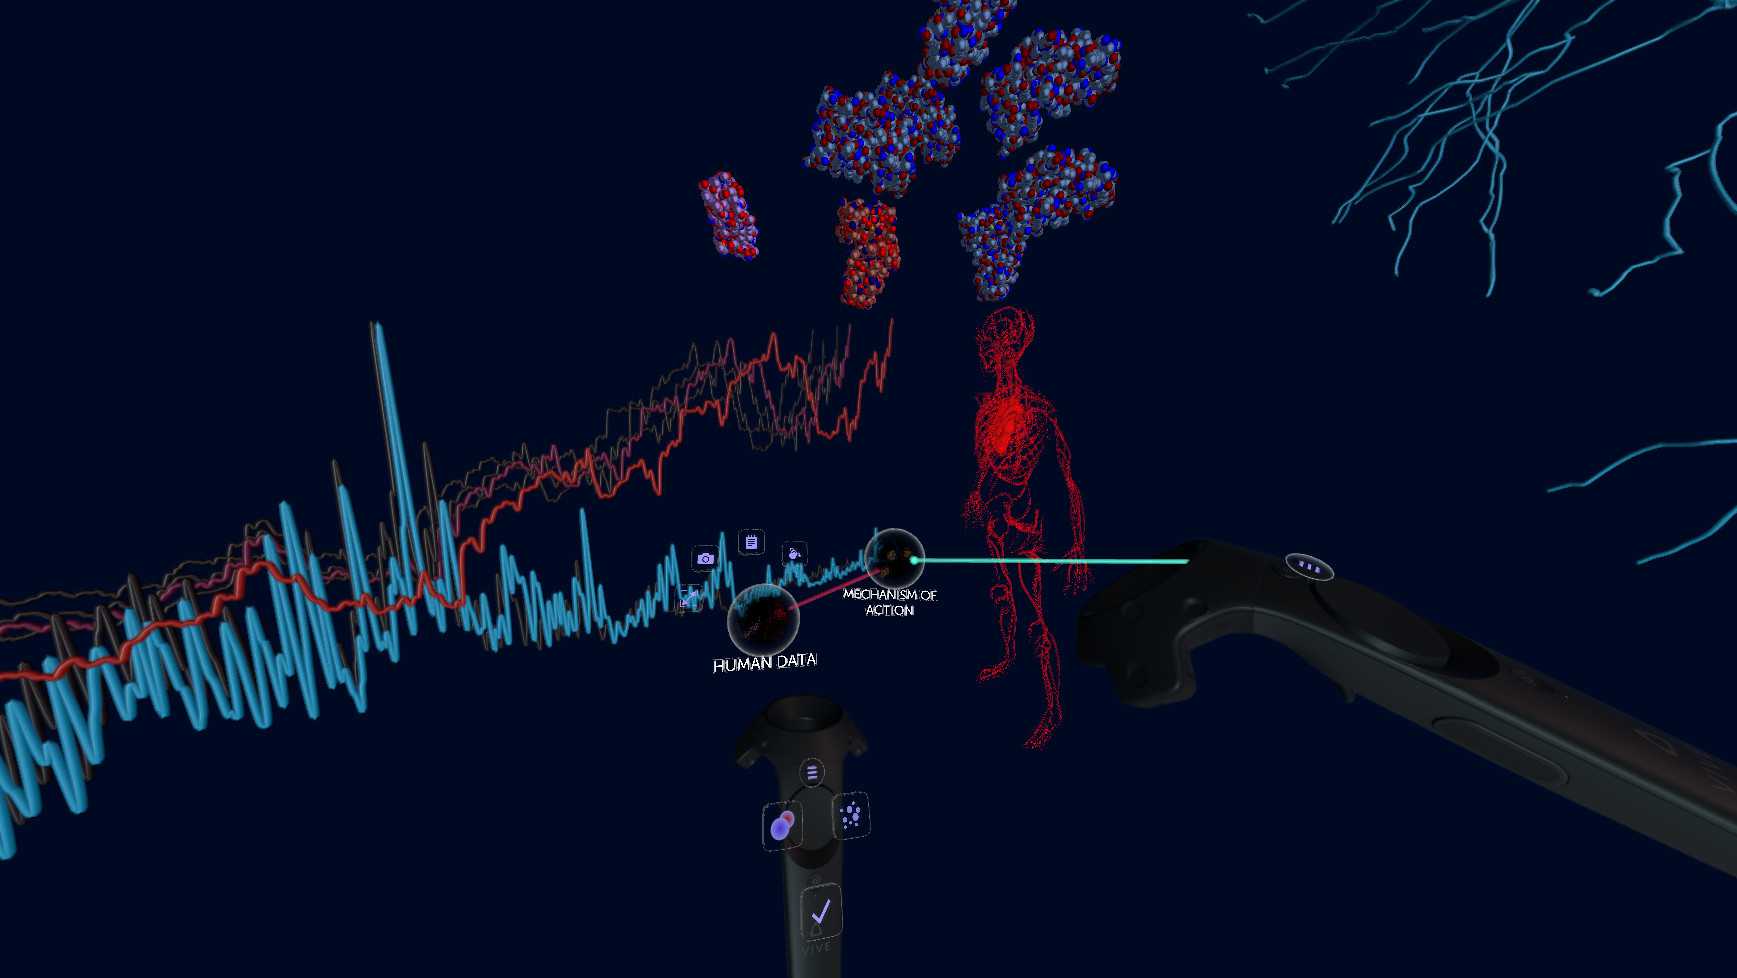
You can think about the experiences created with 10k as a kind of VR slide presentation, but with data visualization options other than standard graphs, and hyperlinks between the slides. It’s sort of like Prezi meets Tableau, but each “slide” is a rich, immersive world full of 3D objects, text, and audio.
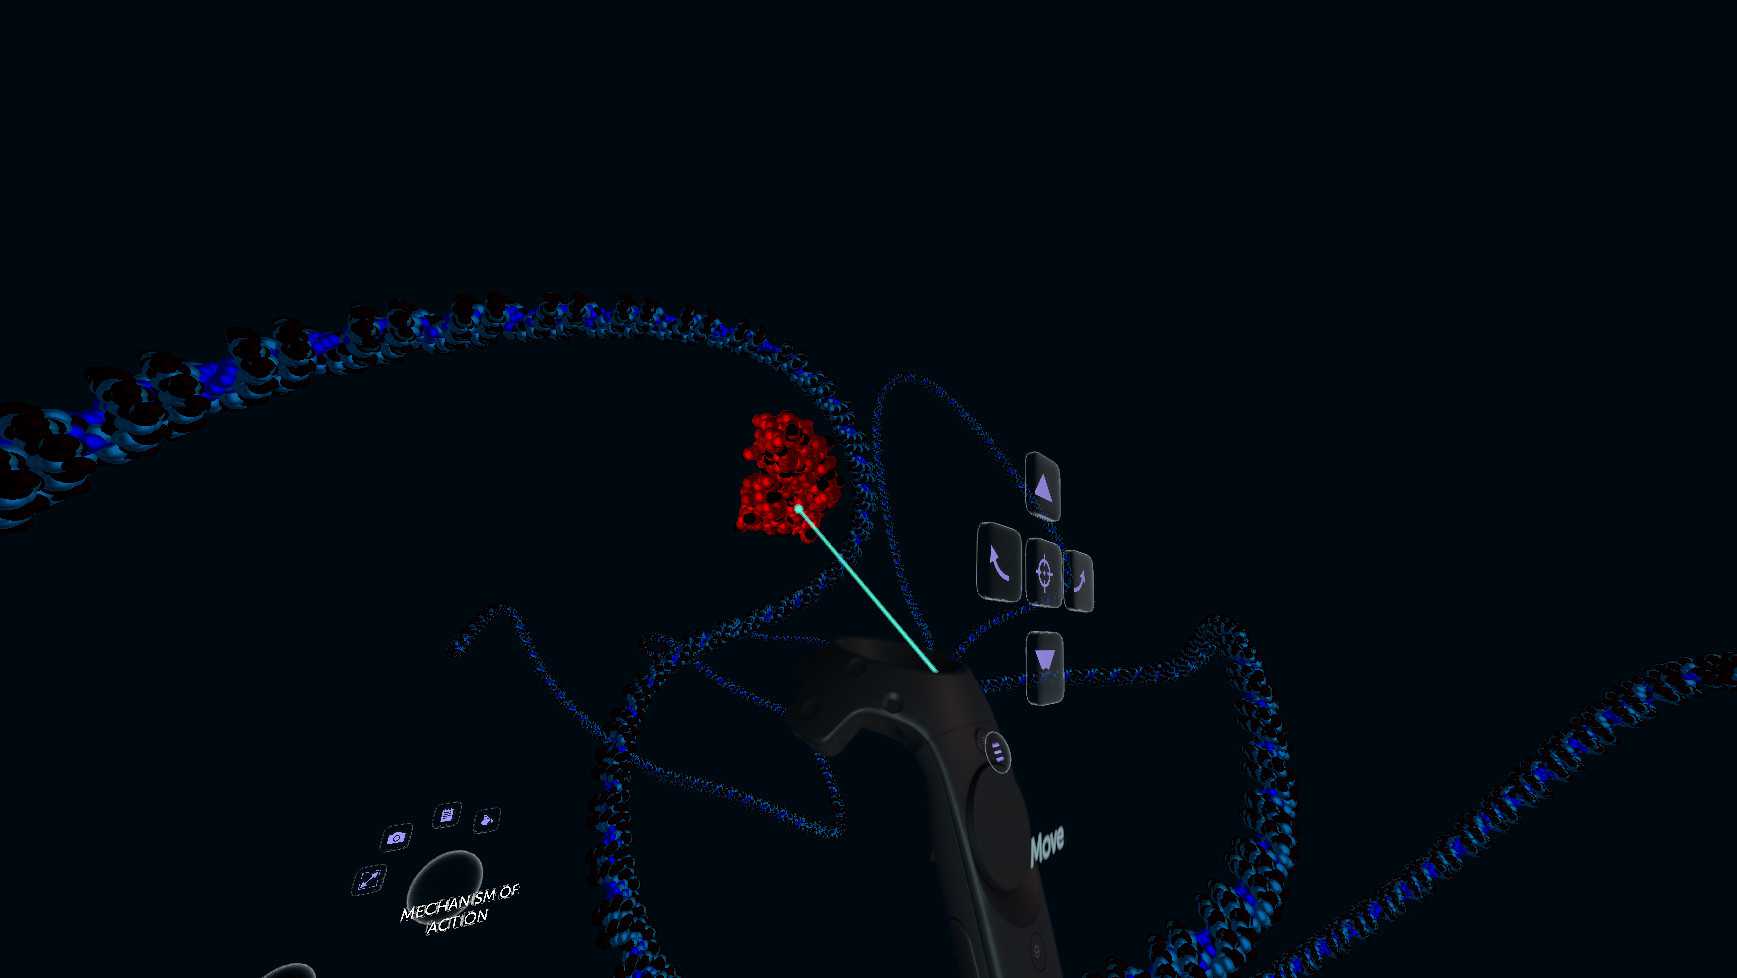
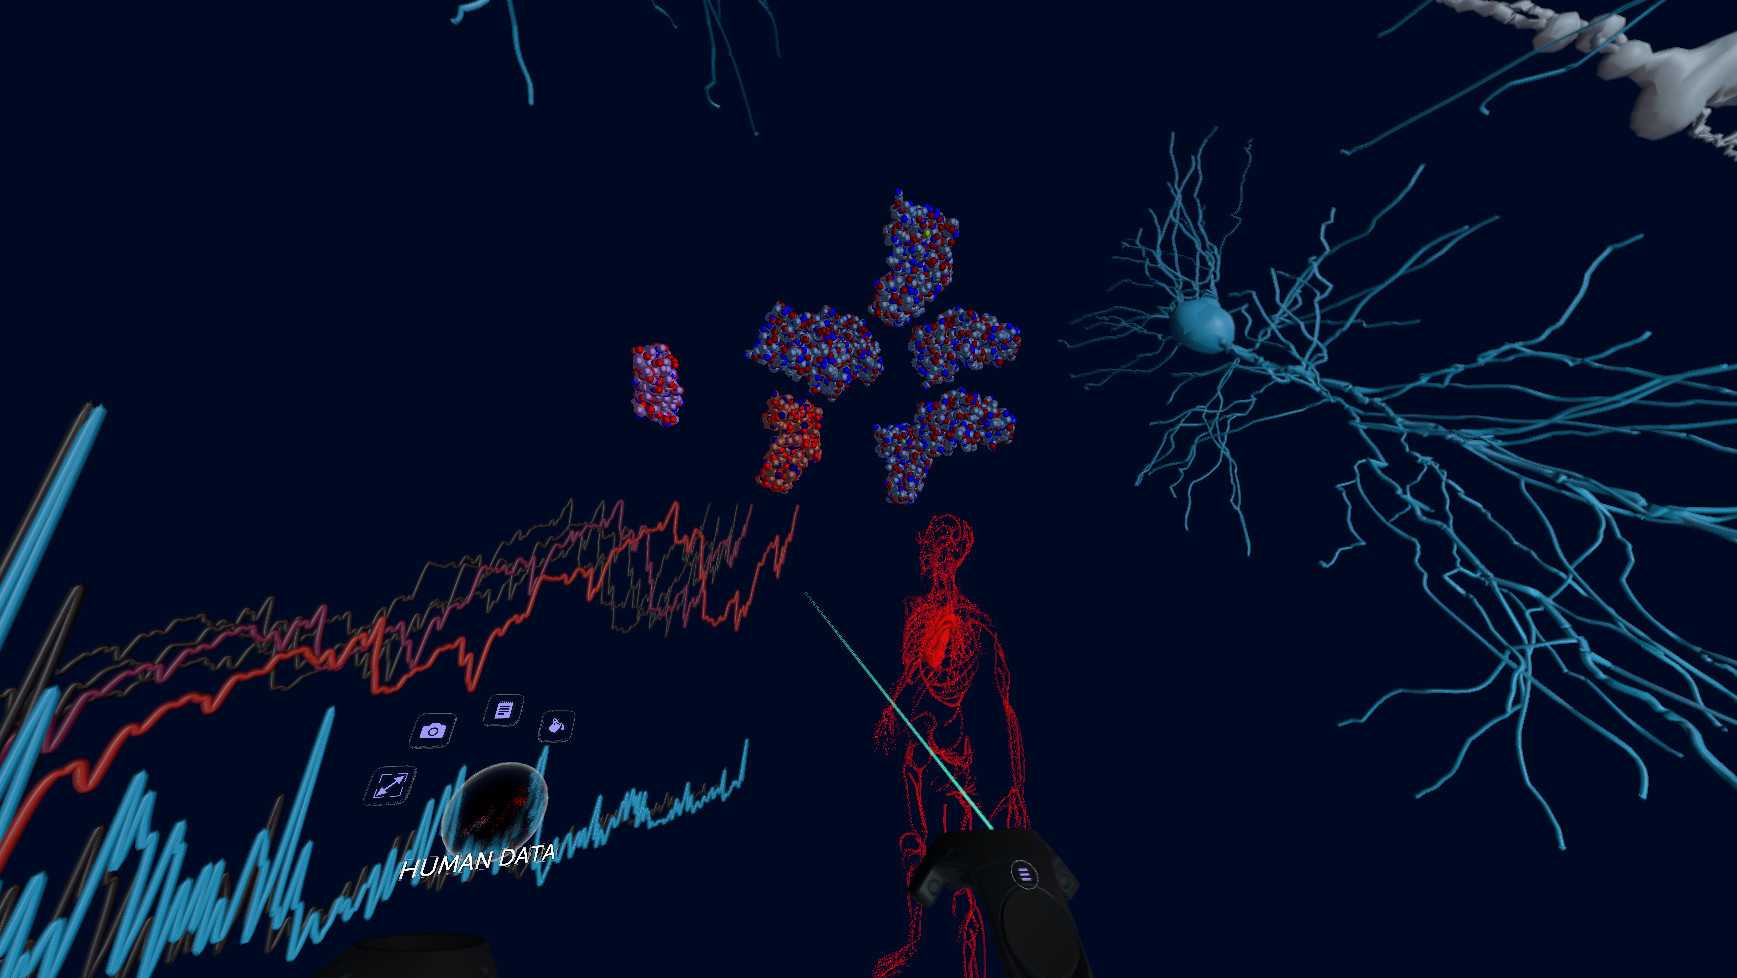
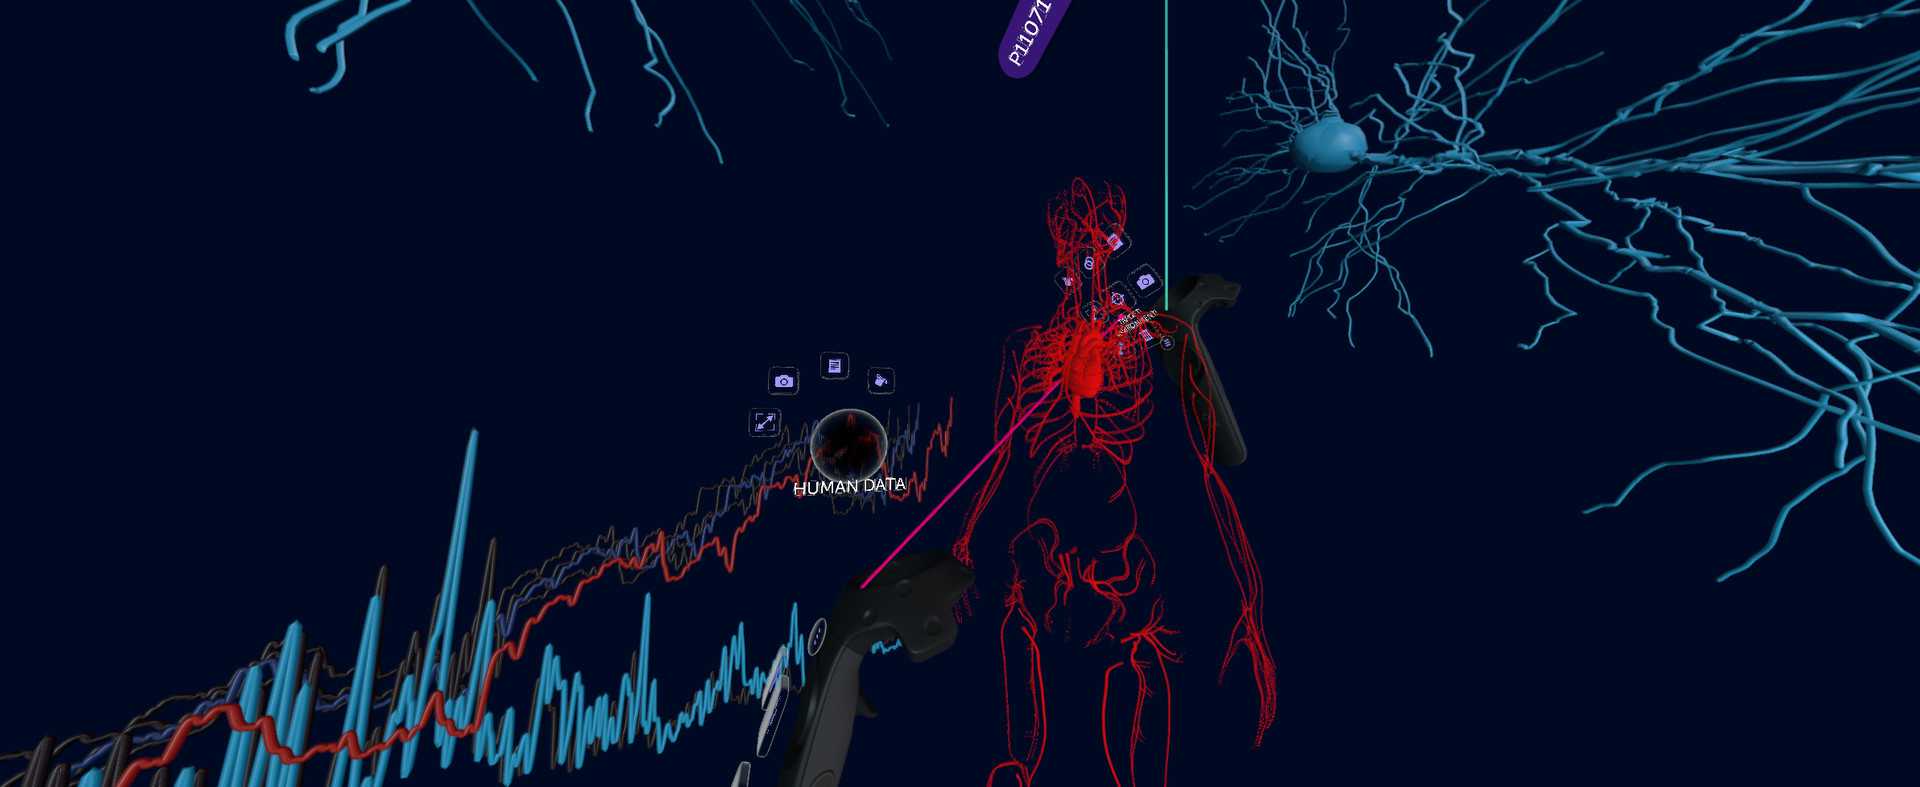
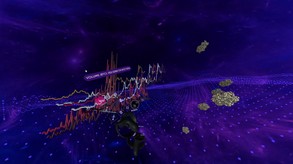
For example, in one of our demo experiences, users can zoom into a plant down to its cells, go inside a cell, then zoom into the nucleus down the molecular level. Each “level” is a separate environment full of 3D models, imported protein structures, images, etc. In another demo, we imported some datasets from Quandl, and show carbon dioxide emission levels and solar energy consumption per country as 3D animated bar graphs on a globe. Labels and descriptions pop up as users point to objects, and can be edited and remixed freely. Basic behaviors, such as random motion and objects “following” other objects, can be applied.
Over the last 8 years, the Dynamoid team has been working on our internal tools for importing, processing, and visualizing a variety of datasets. This technology forms the core of the 10k platform, and includes data parsers, visualizers, shaders, and a behavior system.
Currently, we support importing 3D models, protein crystal structures, time-series economic data, images, neuron cell structures, and some MRI/CT scans. Users can upload their own files, or instantly grab content from a variety of integrated APIs, including Google Poly, the Protein Data Bank, NeuroMorpho, and Quandl (economic data).
Editores
DynamoidDesarrolladores
Dynamoid
Fecha de salida
Agosto 15, 2018
SOs compatibles
Entrada
Forma de juego
Comentarios (0)